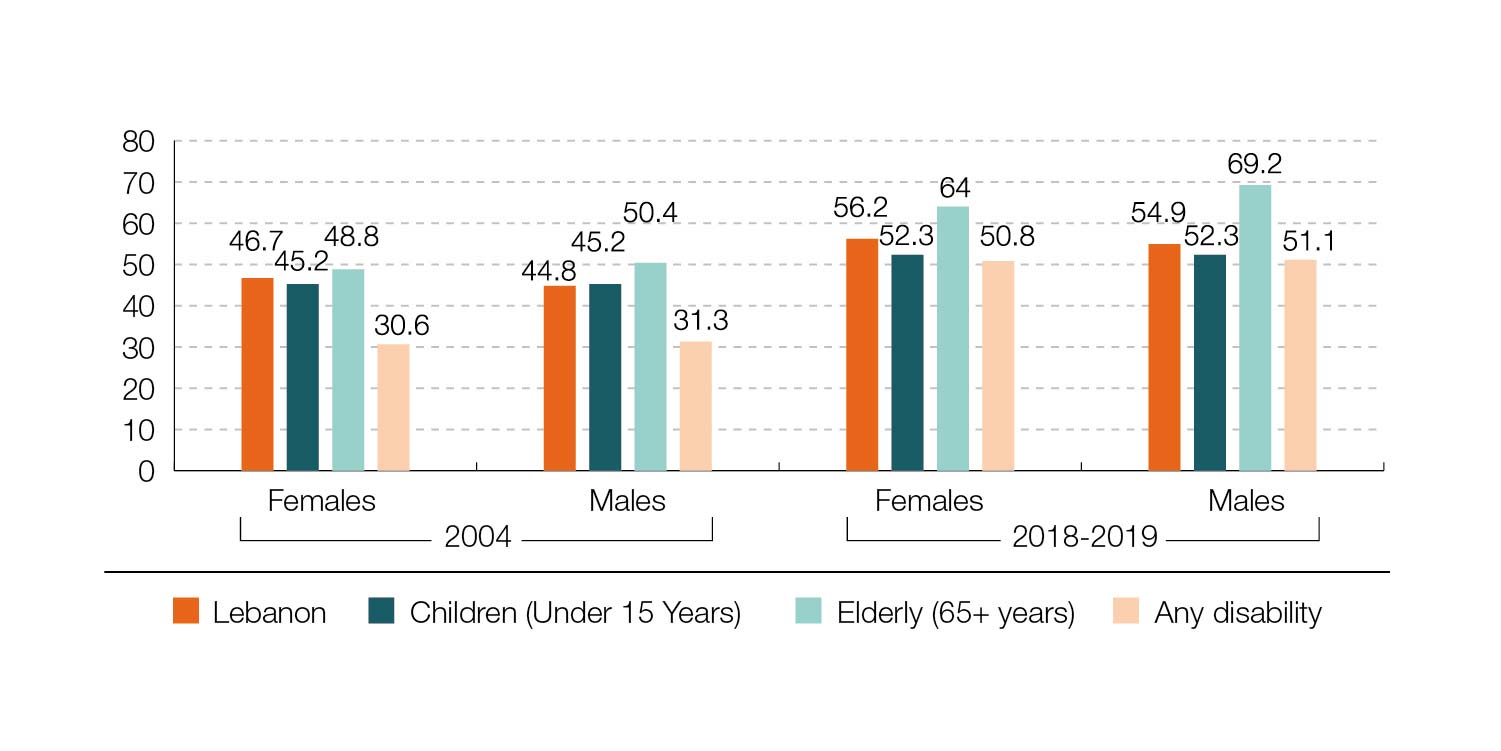
Resident Population That Benefits from at Least One Type of Health Insurance, Distinguishing Children, Elderly and Persons with Disabilities by Gender (Percentage), 2004 vs. 2018-2019
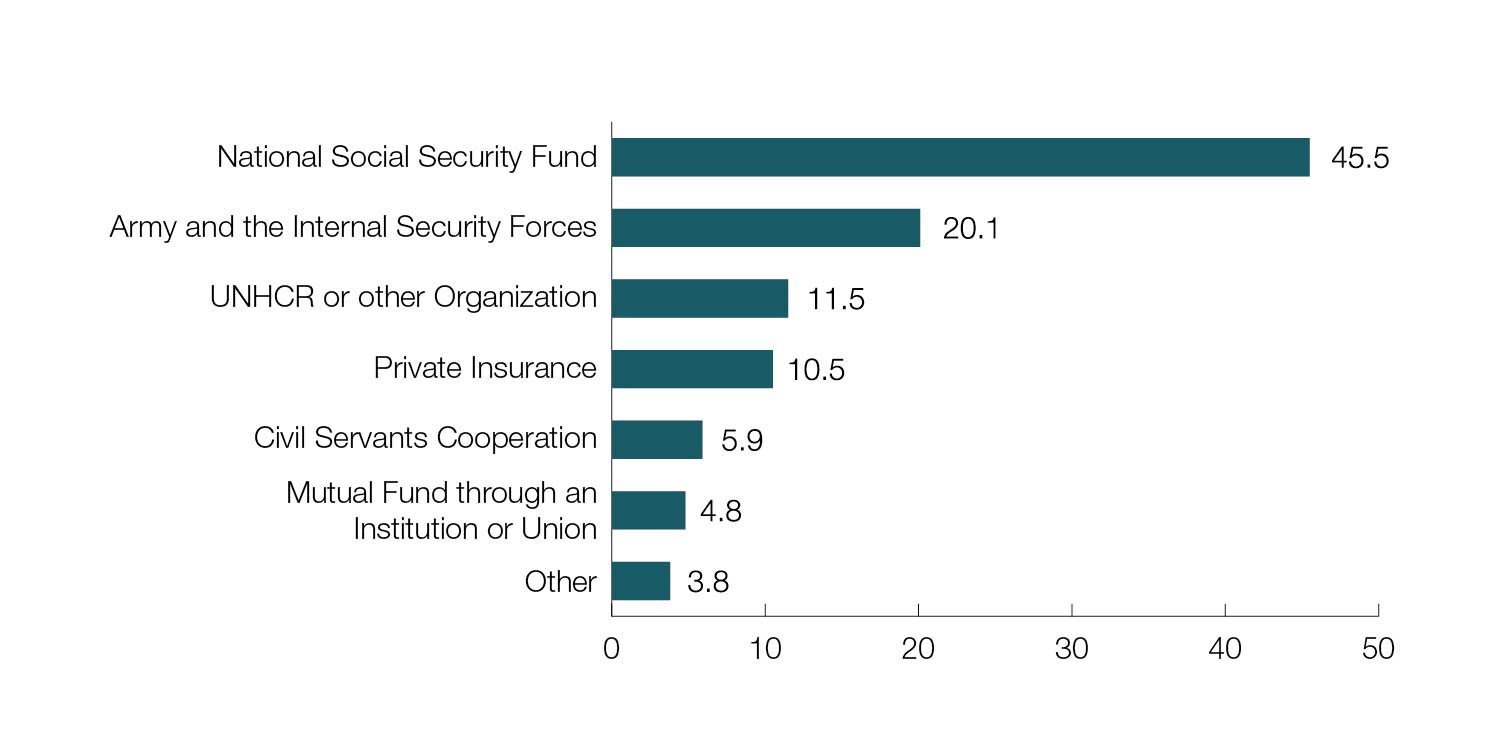
Type of Health Coverage of Resident Population (Percentage), 2018-2019
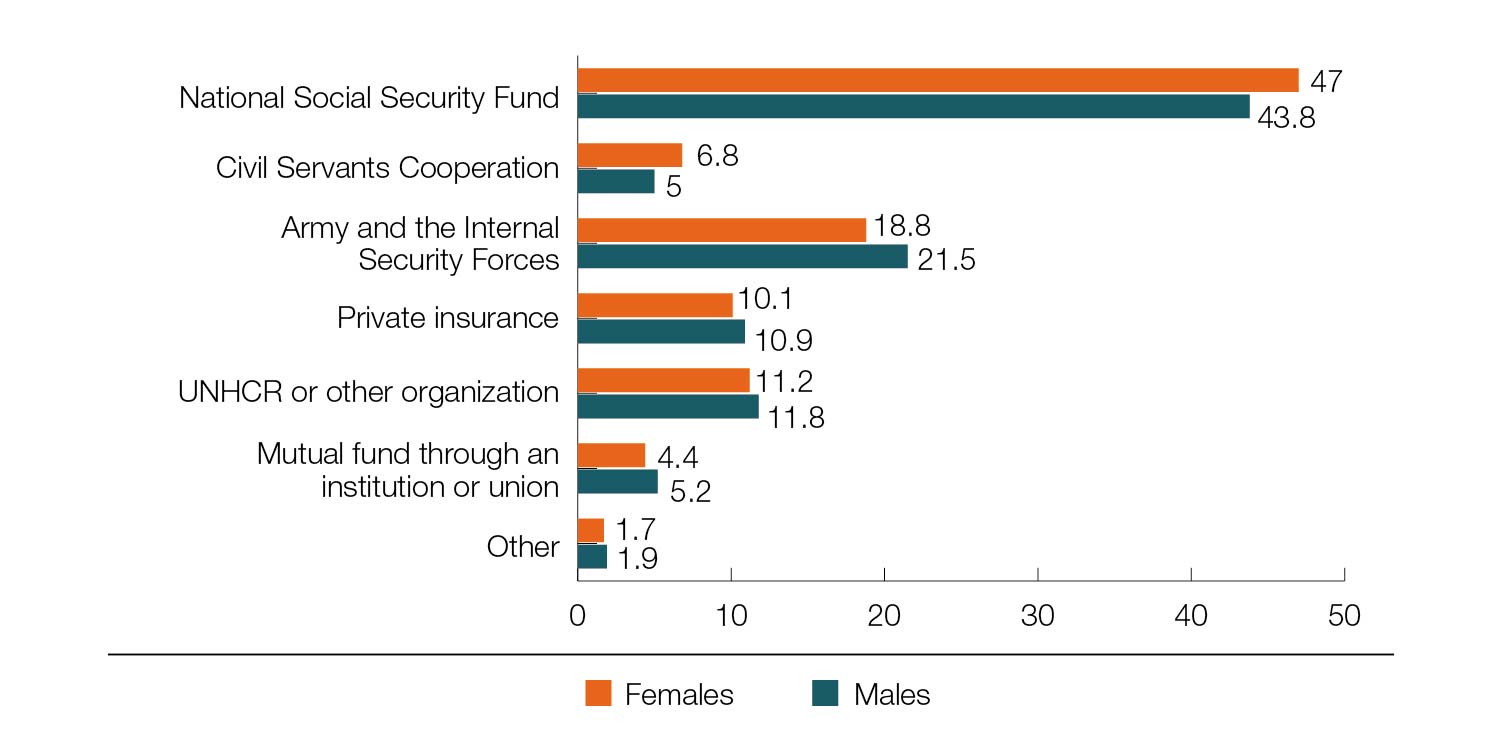
Type of Health Coverage of Resident Population by Gender (Percentage), 2018-2019
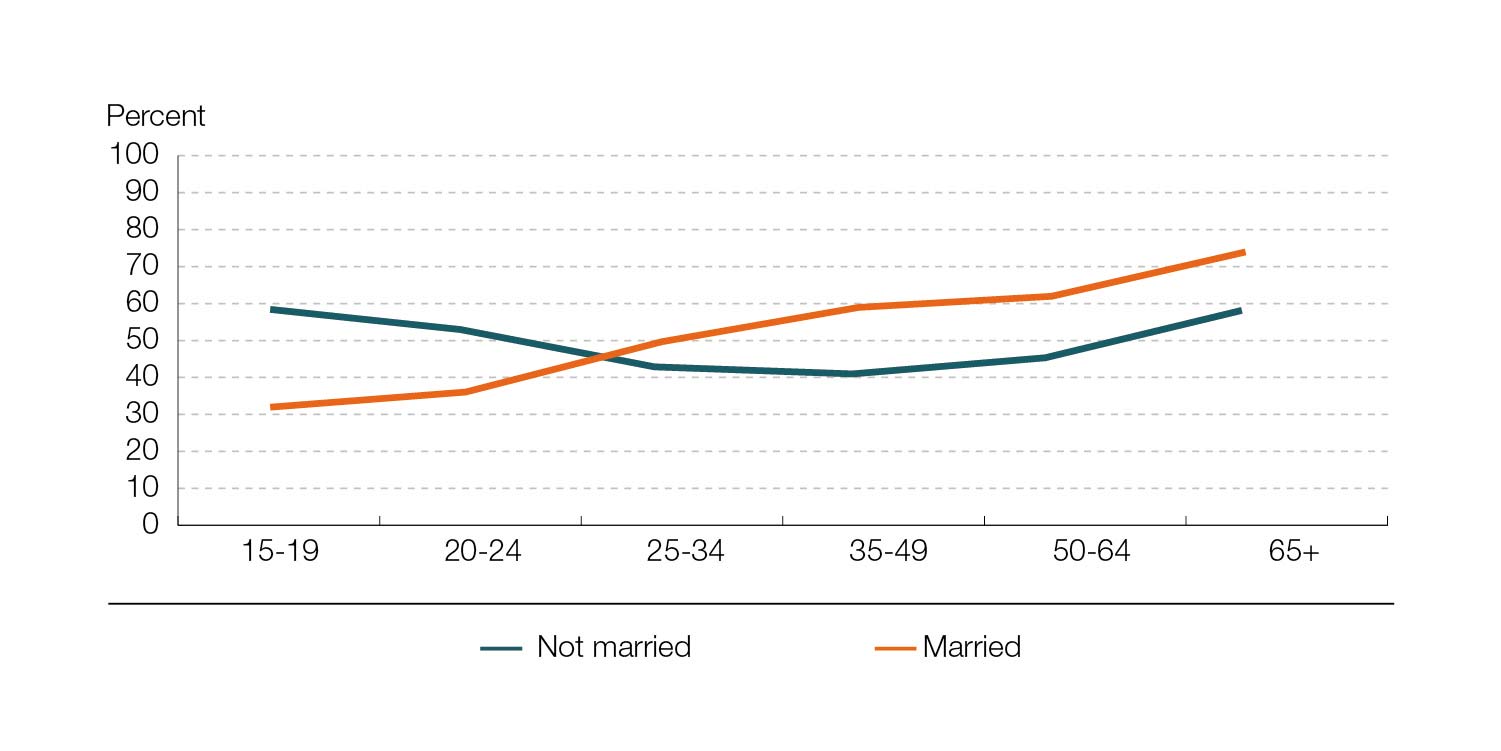
Probability of Female Residents having Health Insurance by Age and Marital Status (Percentage), 2018-2019
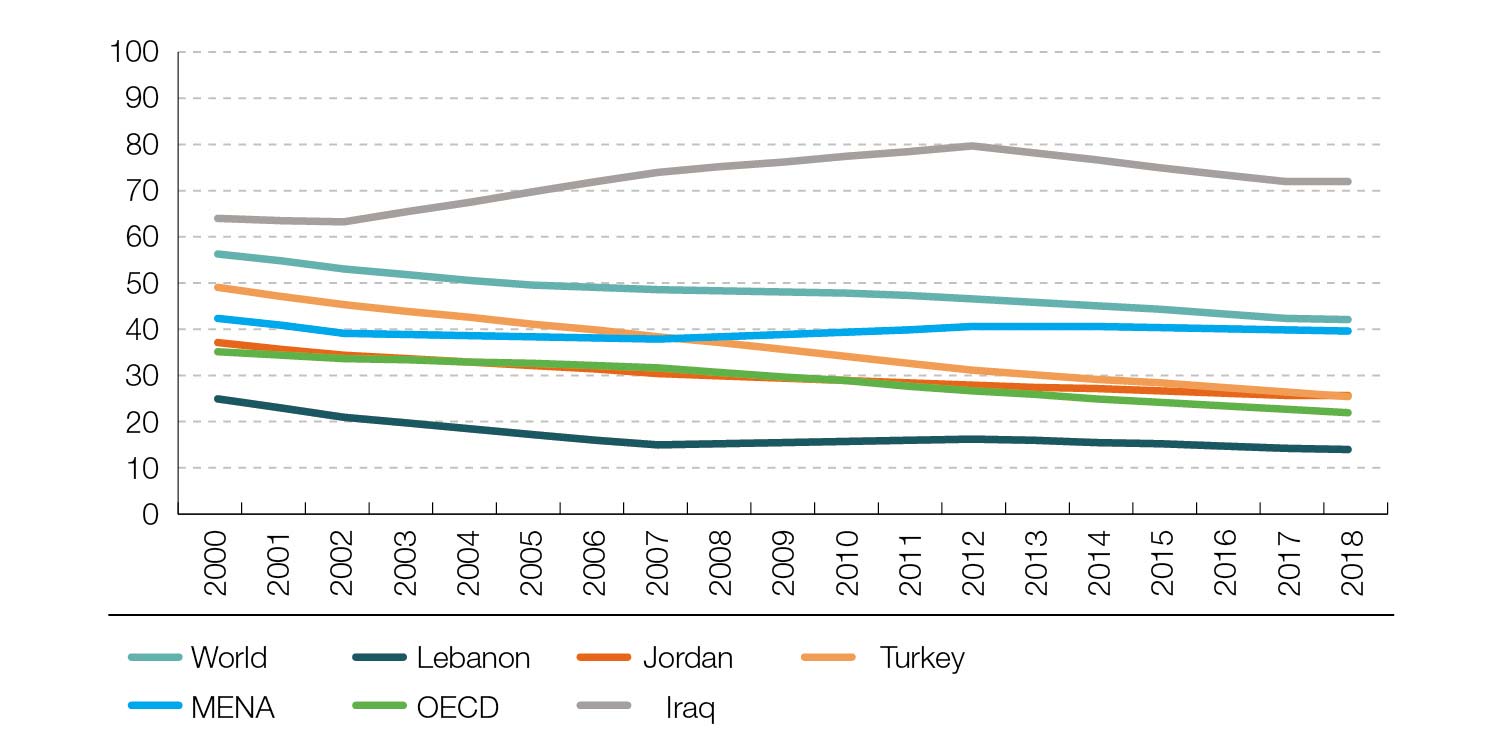
Adolescent Fertility Rate of Resident Population (Percentage), 2000 to 2018
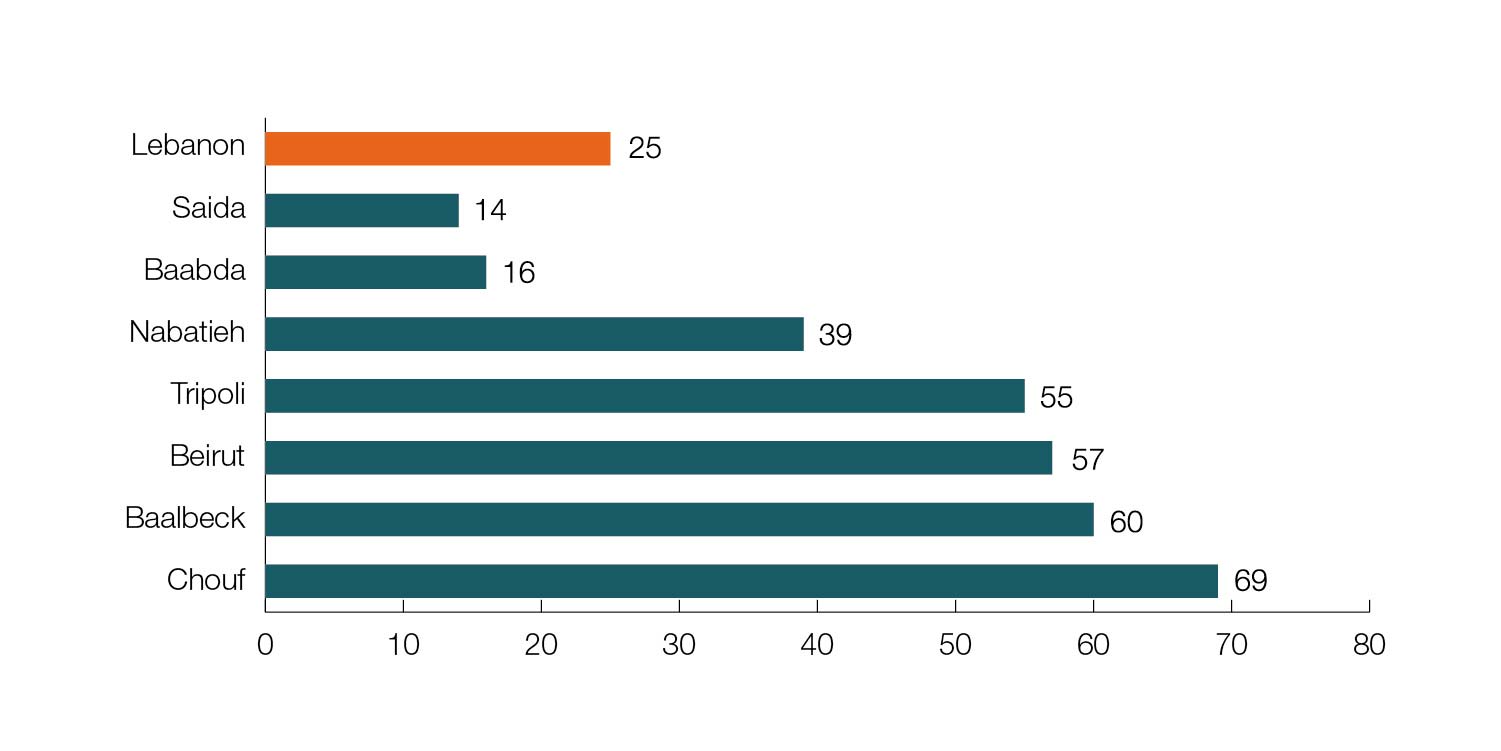
Maternal Mortality Ratios of Resident Population in Selected Locations (Per 100,000 Live Births), 2011
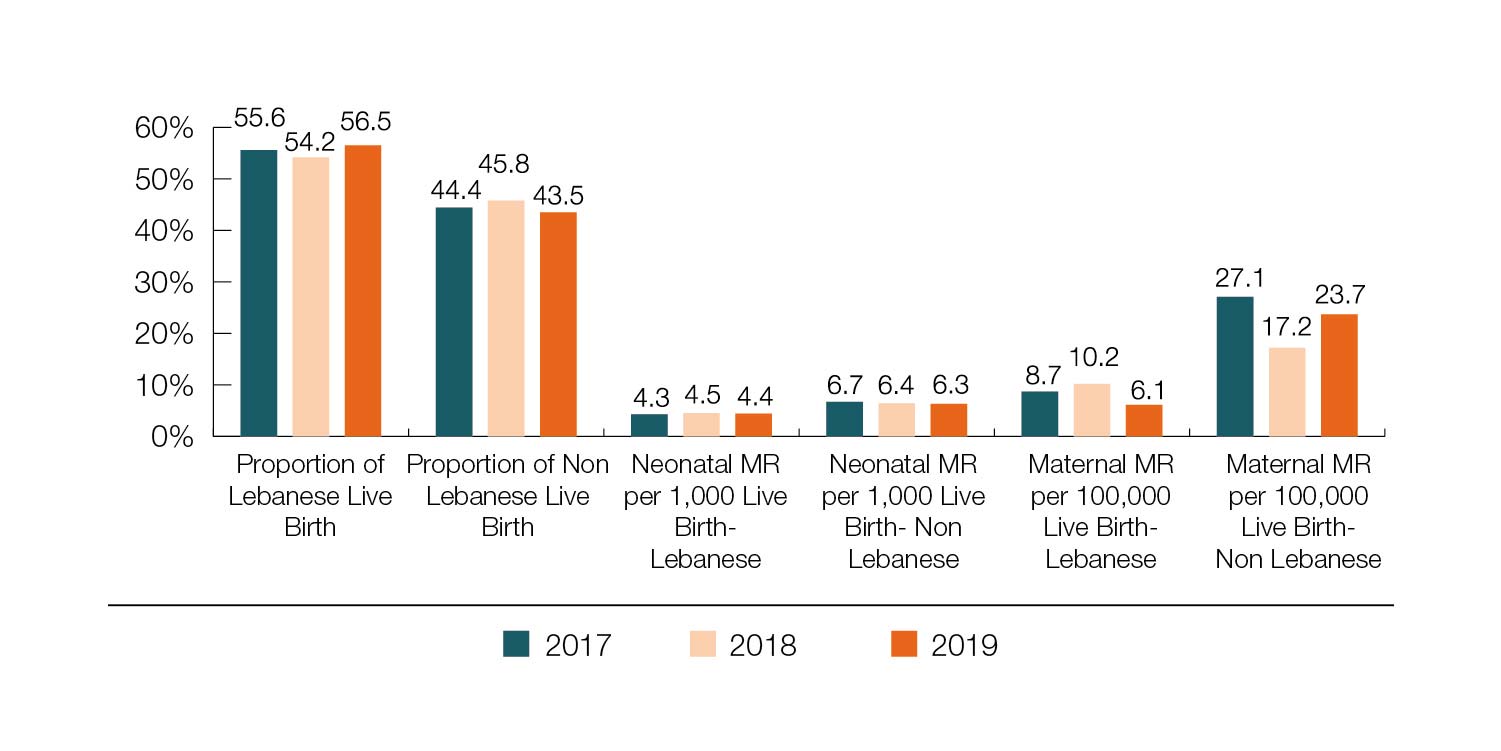
Selected Health Indicators by Nationality (Percentage), 2017 to 2019
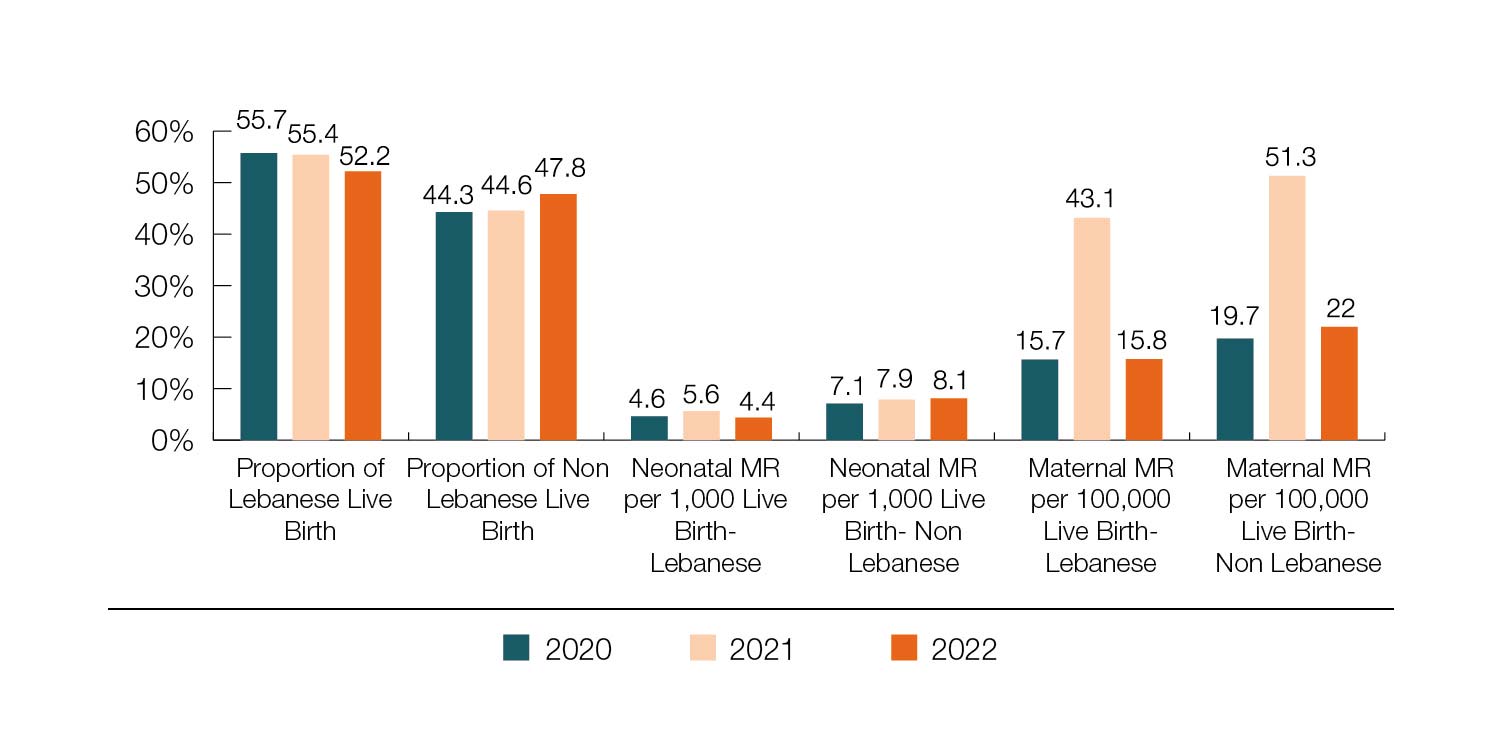
Selected Health Indicators by Nationality (Percentage), 2020 to 2022
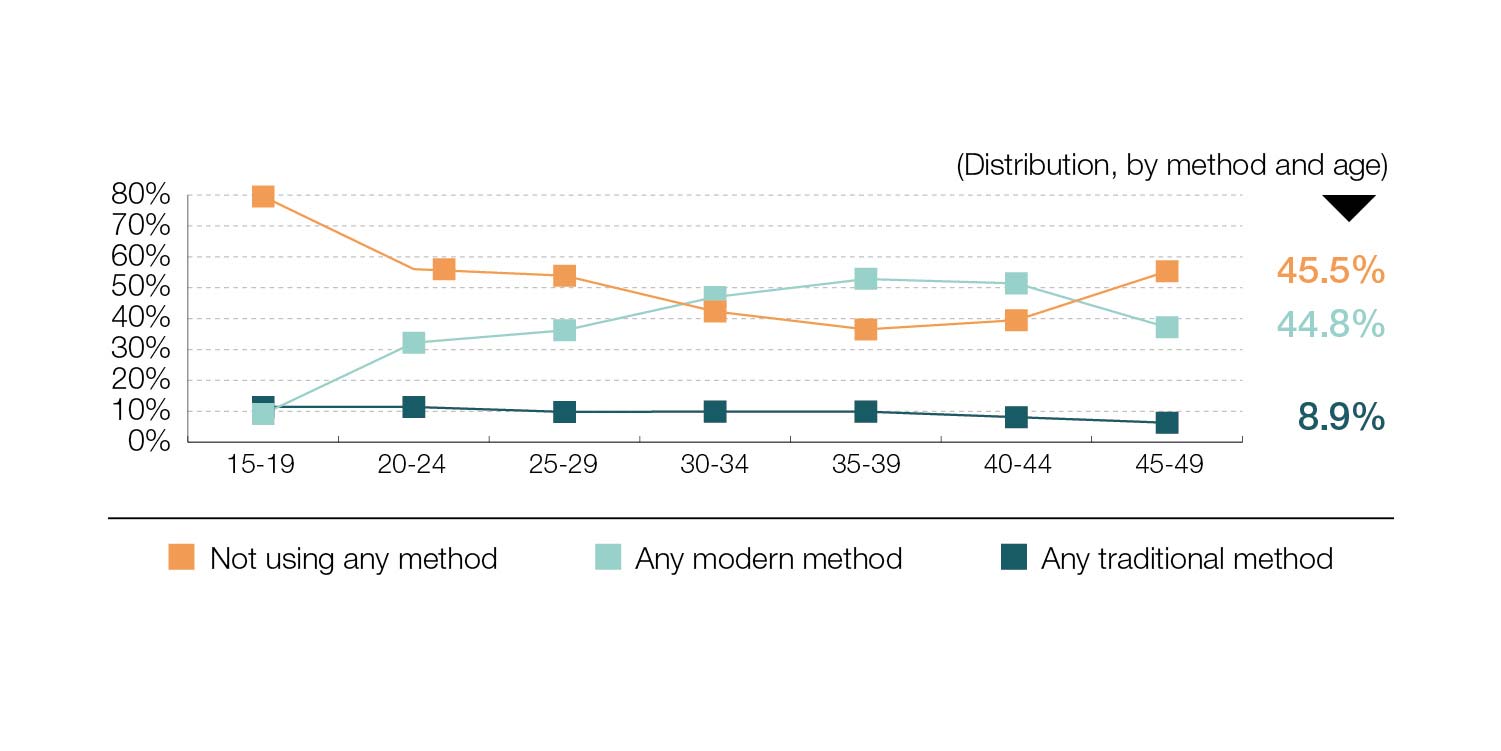
Use of Contraception by Currently Married Females Aged 15-49 years (Percentage), 2018-2019
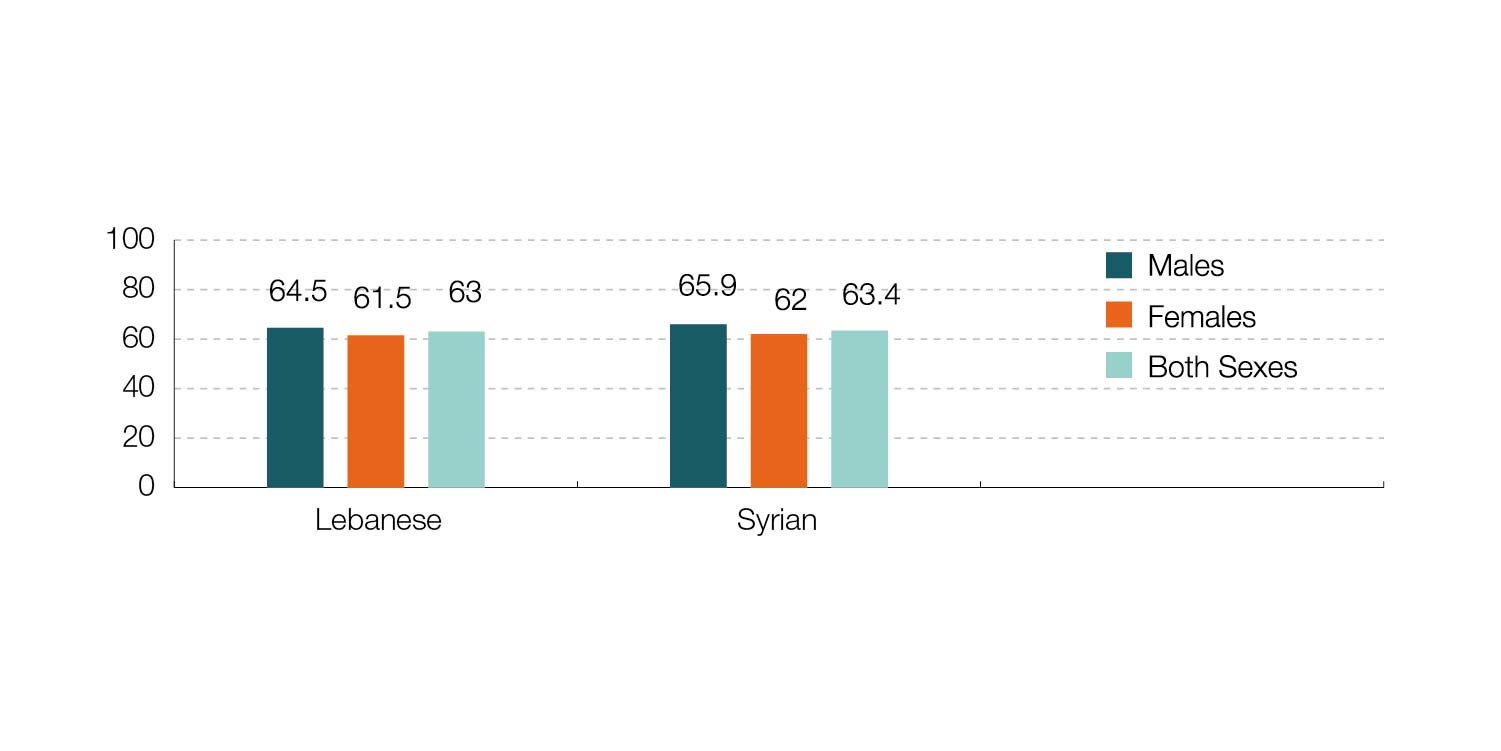
Resident Population Taking Medication for Raised Blood Pressure by Gender and Nationality (Percentage), 2016-2017
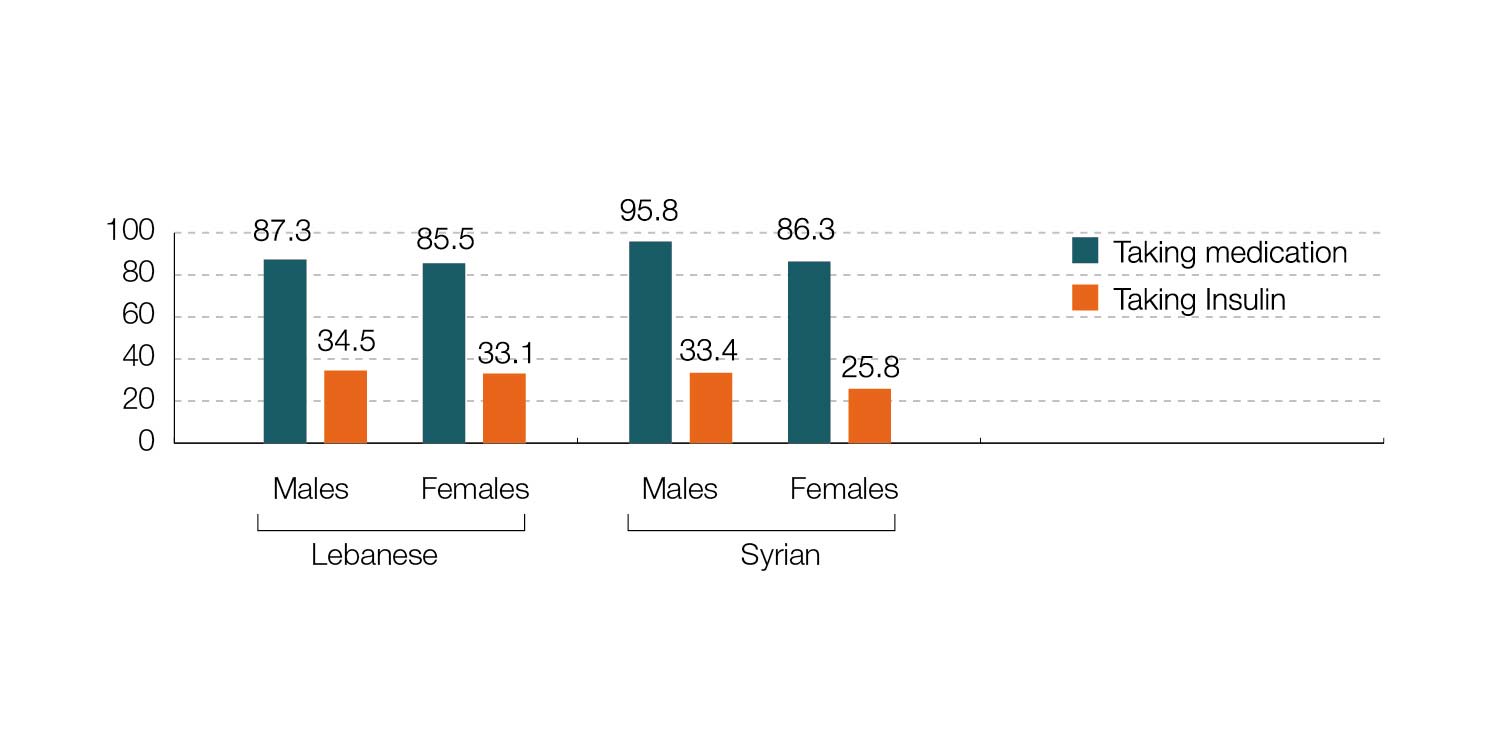
Resident Population Taking Medication or Insulin Prescribed for Diabetes by Gender and Nationality (Percentage), 2016-2017
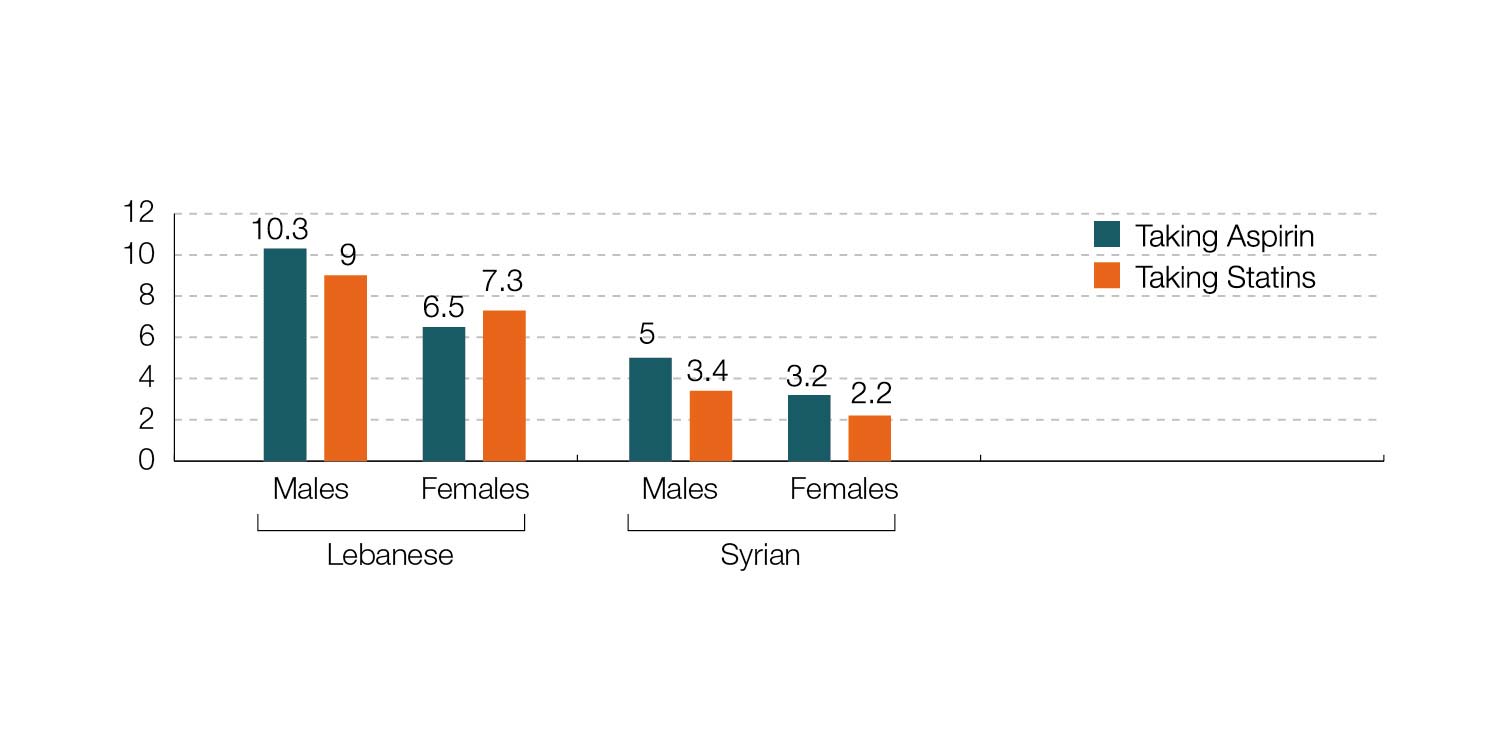
Resident Population Taking Regularly Aspirin or_and Statins to Prevent or Treat Heart Disease by Gender and Nationality (Percentage), 2016-2017
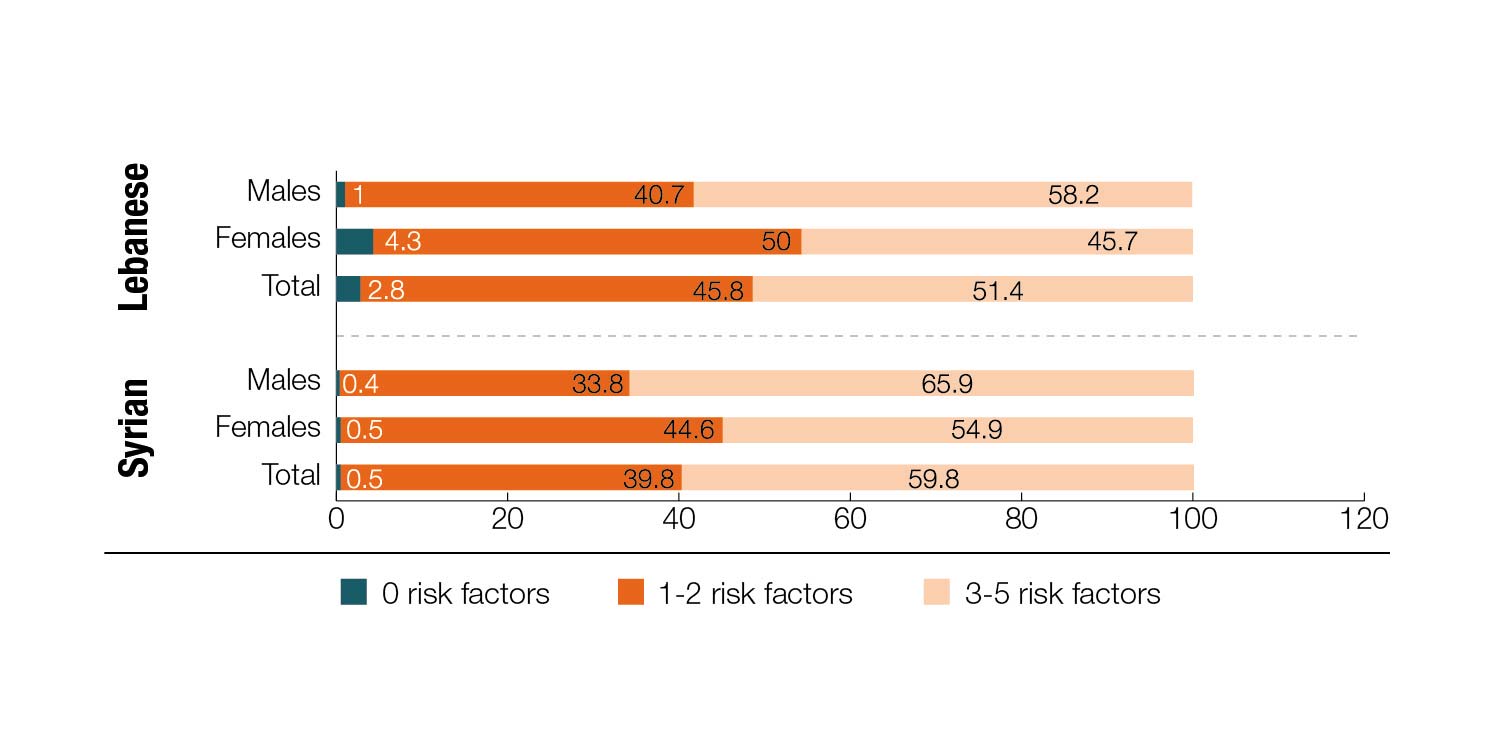
Summary of Combined Risk Factor among Resident Population by Gender and Nationality (Percentage), 2016-2017
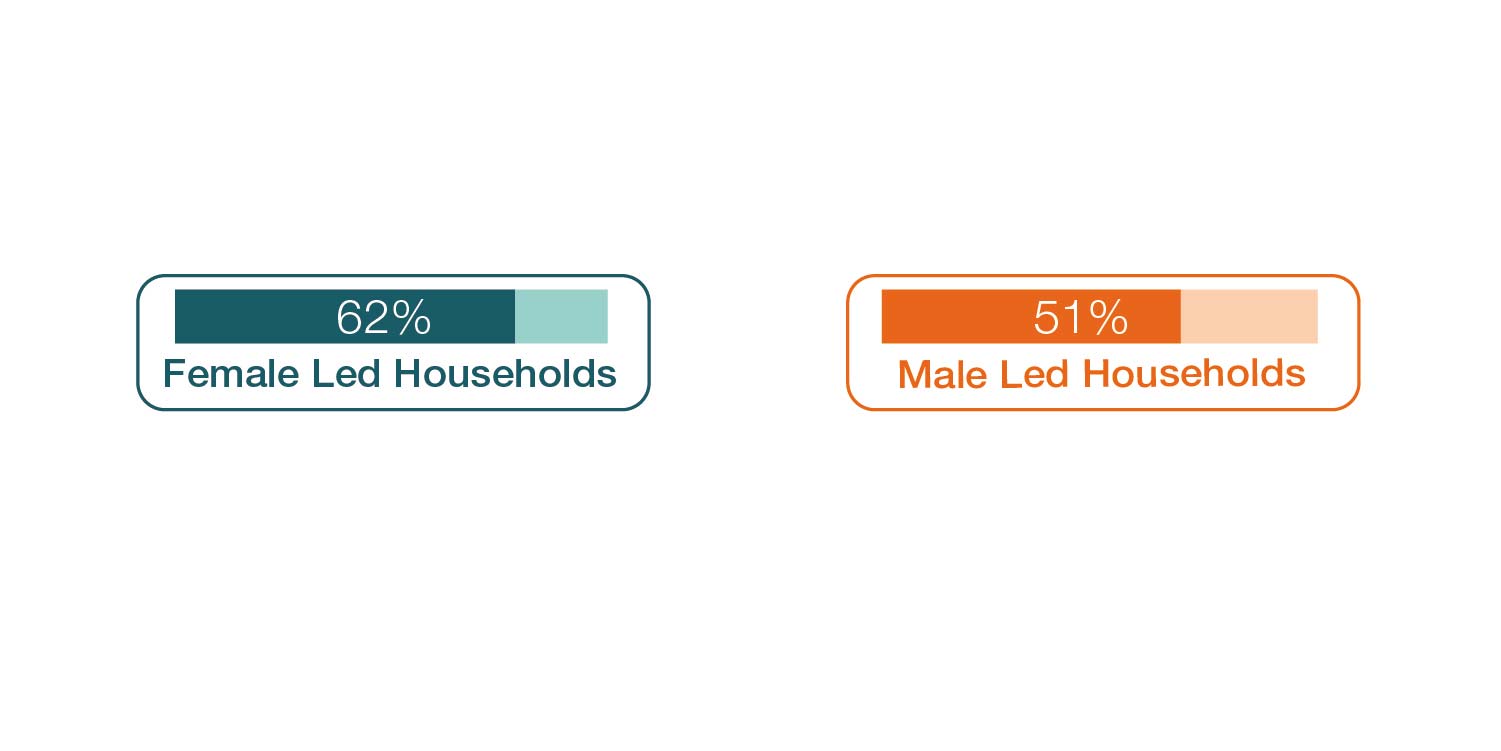
Access to a Formal Health Care Provider and_or a Family Doctor of Lebanese Households by Gender (Percentage), 2010
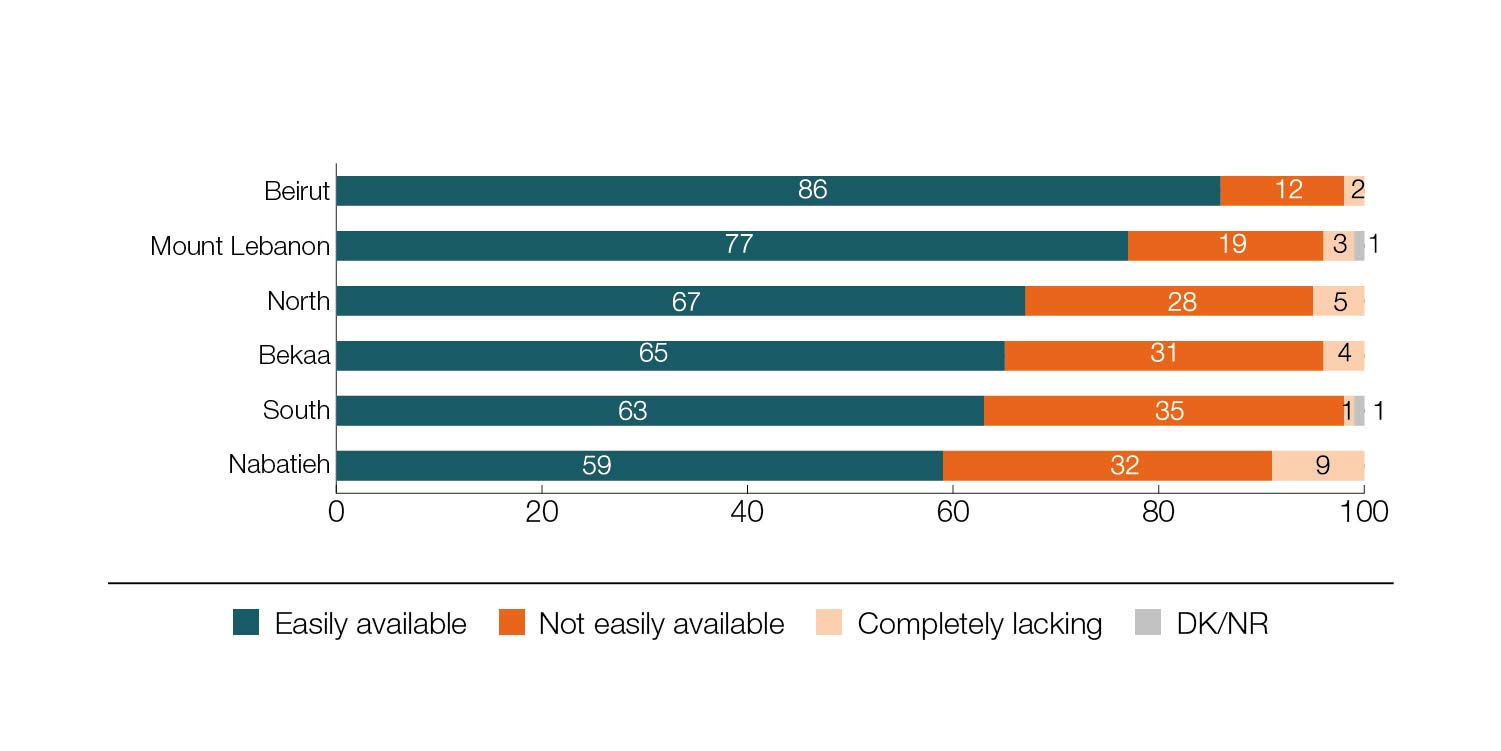
Medical Services Available Close to Home to Lebanese Households by Governorate (Percentage), 2010
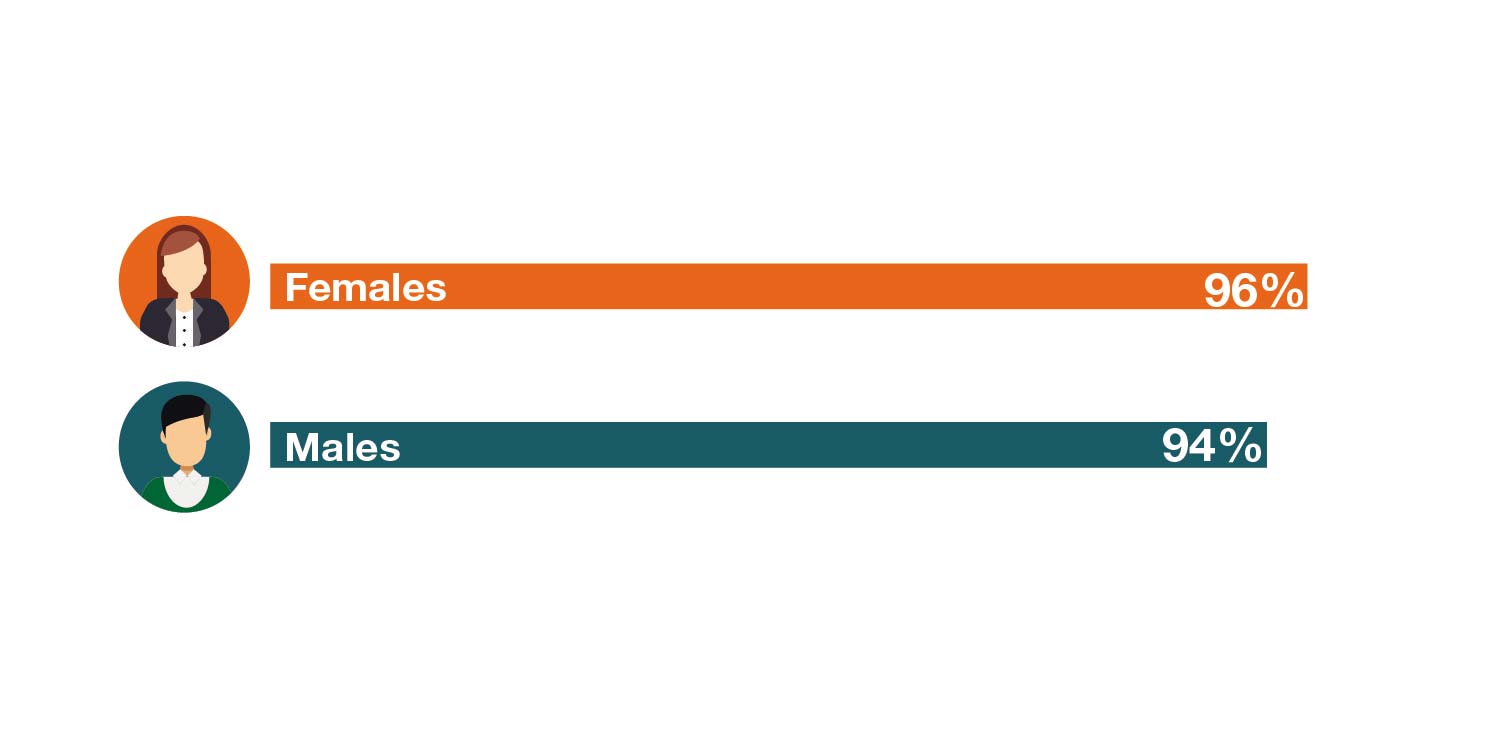
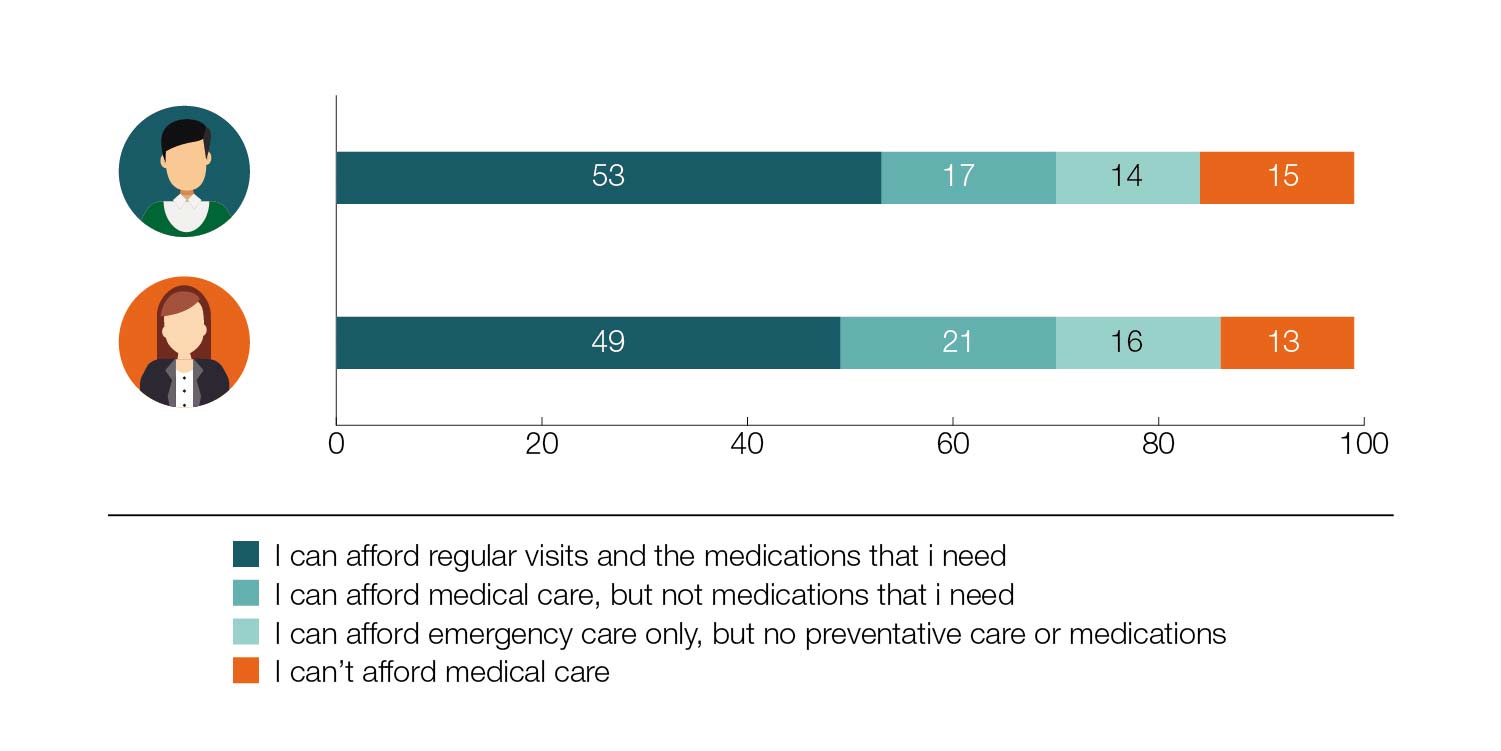
Ability of Lebanese Households to Afford Healthcare Servides by Gender (Percentage), 2010
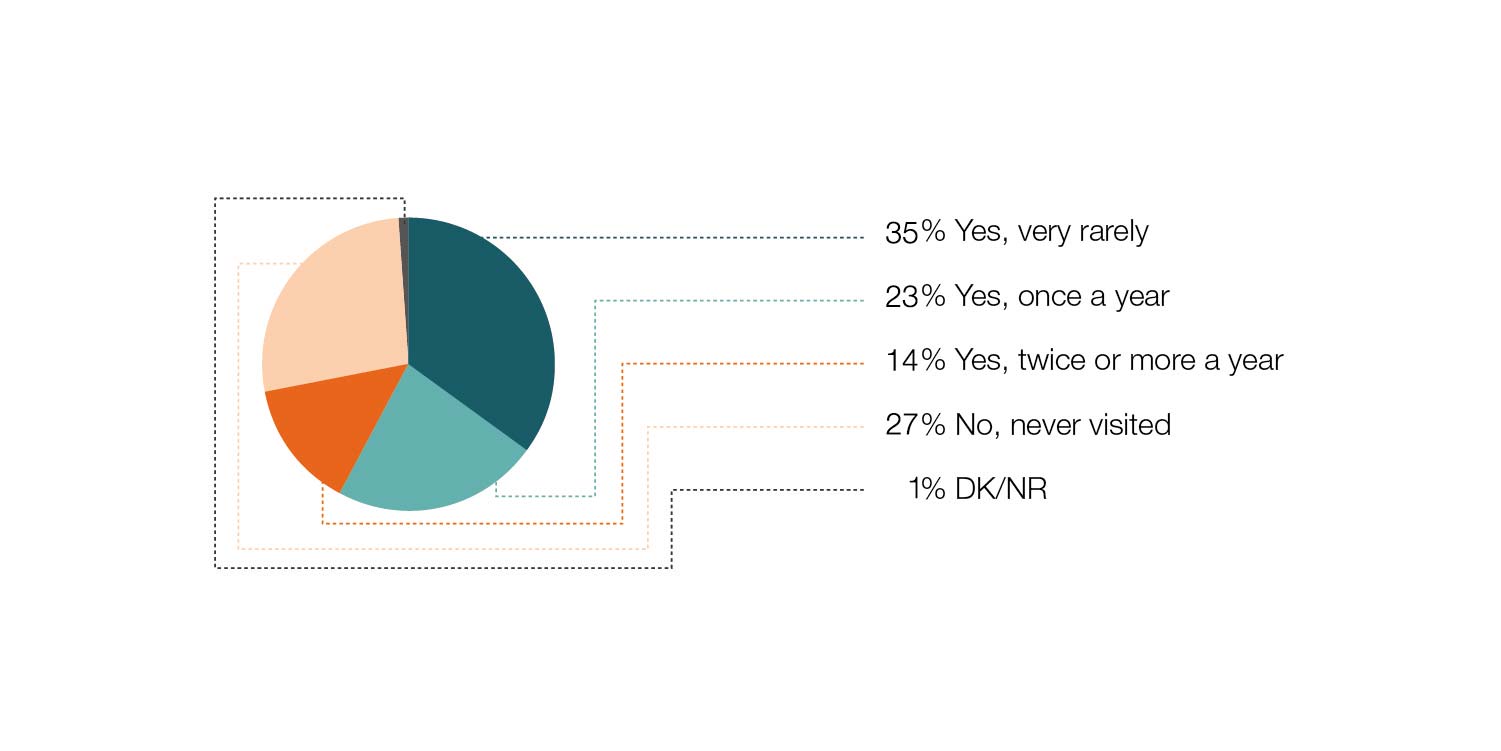
Lebanese Females that Have Ever Visited a Gynecologist _ Obstetrician (Percentage), 2010
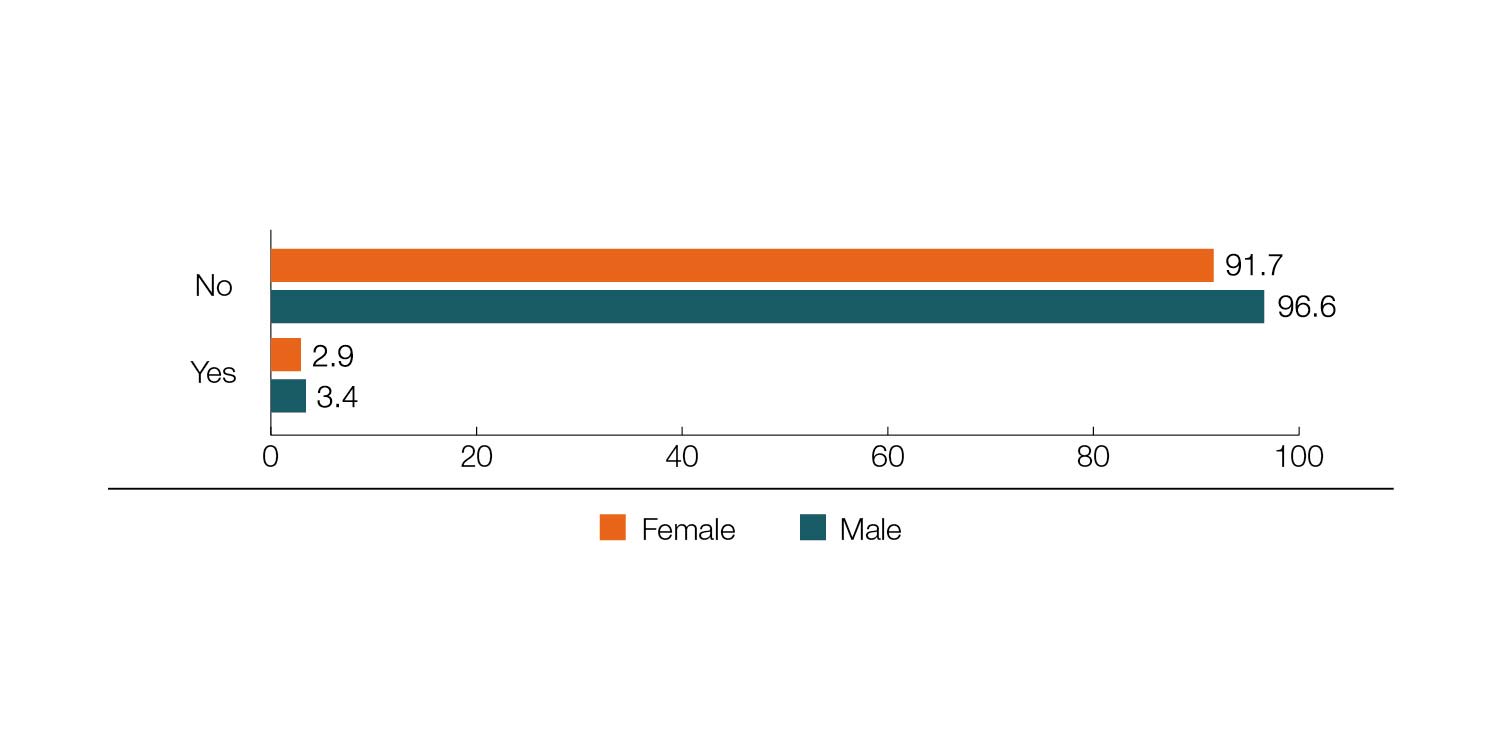
Resident Population Regularly Having Unmet Medical Needs by Gender (Percentage), 2018-2019
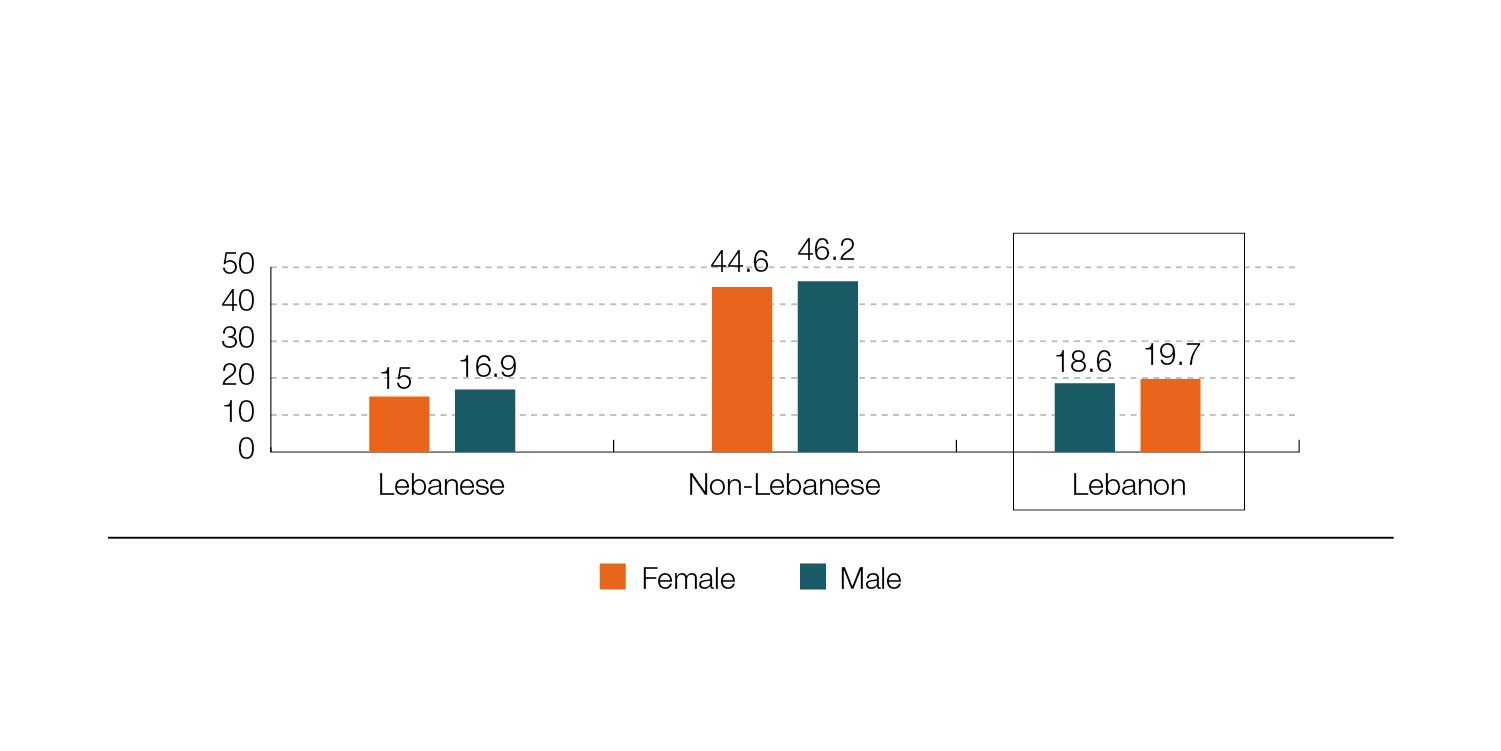
Unmet Needs of Resident Population for Regular Medications or Medical Services for Self-reported Chronic Diseases by Gender and Nationality (Percentage), 2018-2019
Percentage of 60+ Lebanese Head of Households with Unmet Primary Healthcare Needs